Give before midnight on July 31 to double your impact where trees need us most. CHOOSE A PROJECT

Arbor Day Foundation Reporting Platform Backs Up Numbers with Storytelling
Impact Dashboard provides partners on-demand access to metrics, insights, and stories of their work with the Foundation.
July 14, 2023

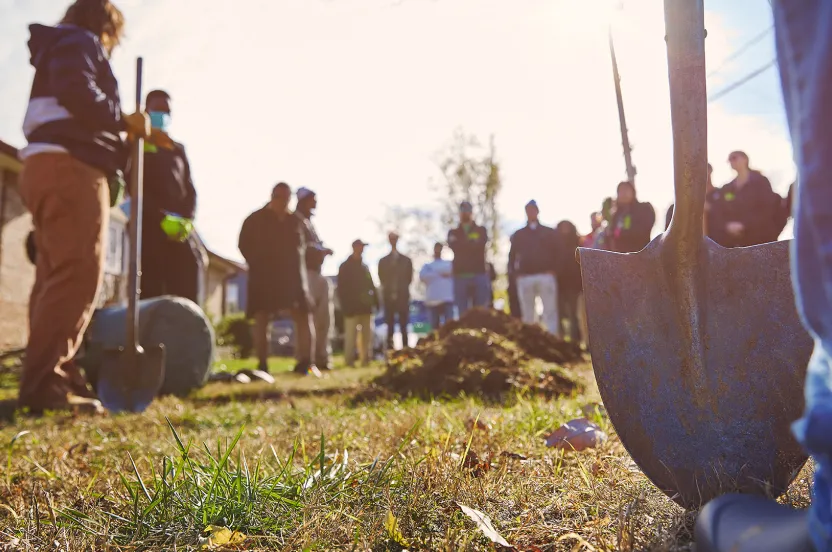
With every planting project, we witness the unmatched benefits trees bring to forests, neighborhoods, and people around the world.
However, it can be difficult to convey the depth of this impact to those outside of the organization through words — or numbers — alone. The Impact Dashboard solves this problem by providing meaningful context to the Foundation’s partners through a combination of science-based metrics, reportable insights, and authentic stories.
The Foundation may be more than 50 years old, but the technology it provides partners is anything but vintage. The Impact Dashboard, developed in-house, allows select partners to explore their projects on a macro or project-specific level, layering data from organizations like NatureQuant, USDA Forest Service, World Resources Institute, and more.
What’s in the Impact Dashboard?
When a partner logs in to their unique Impact Dashboard, they’re served a treasure trove of interactive content, curated by their Foundation support team.
They can start by reviewing a written overview of the partnership, quick-read callouts of trees planted and distributed, number of projects, acres restored, and timeline for completion. They can explore a detailed map with project locations pinpointed. Clicking into each project reveals even deeper details: downloadable photos, biodiversity notes, a look at species benefitting from the project, and demographic data about neighborhoods, for starters.
Instead of combing through individual reports, spreadsheets, or emails, the partner can see everything they need in one place. It’s a one-stop destination for all the juicy numbers for a corporate sustainability report or progress update for the C-suite.
An Impact Dashboard, Heavy on the Impact
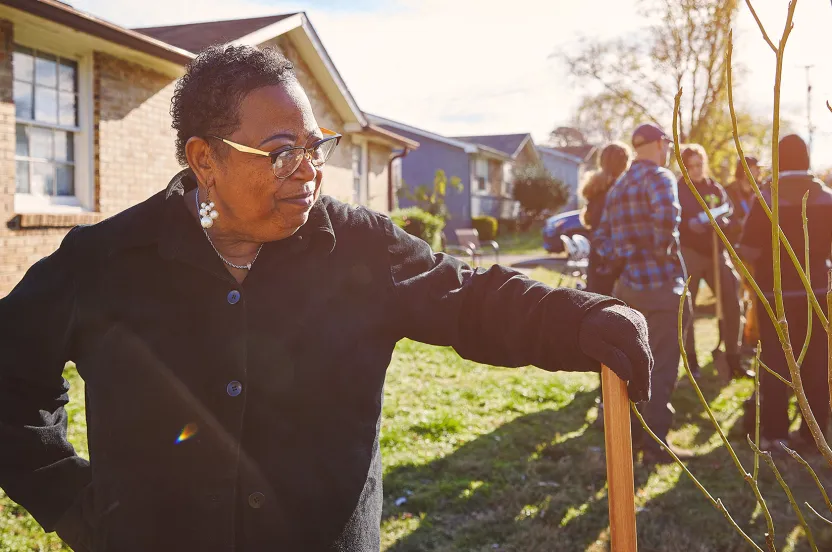
We understand better than any organization that it’s not about the number of trees planted, but the impact they create. The cherry on top of this offering is the vivid storytelling woven throughout the tool. Partners can access short- and long-form impact stories that provide meaningful context about the impact their project generated: how the trees are supporting people, neighborhoods, and the planet.
This storytelling is value-added marketing support that partners would be hard-pressed to find from other organizations. We believe sharing stories is essential to understand the true value of planting trees — numbers can only show us so much.
How Do Metrics Support Accountability?
Partners should expect growing calls for responsible tree planting that generates real, quantifiable results. We fully support this increased scrutiny. Tree planting projects, big and small, must be done without cutting corners.
The Impact Dashboard delivers answers to the questions partners are receiving about their efforts. It’s our way of rounding out a project the right way — top-tier data and strict protocols for planting the trees, and advanced technology to track their impact in the years ahead.
How does the Arbor Day Foundation Use It?
With an ambitious planting goal of 500 million trees in five years, the Impact Dashboard will continue to be a key tool for our own tracking. It creates a database of trees planted, and shows us how trees placed in areas of greatest need make the greatest impact. That’s no surprise to the Arbor Day Foundation, but nothing beats having the stories and numbers to back it up.
To learn more about how we’ll plant 500 million trees in 5 years with the aid of corporate partners and other donors, visit arborday.org/atreecanbe. To learn how your organization can get involved, visit arborday.org/corporate-partnerships.
If you’re part of a corporate organization and want to get involved, you can reach out to our team at arborday.org/corporate-partnerships.